MoodCompass® A Guide to the Cycles of Nature and Civilization
About MoodCompass
Originally Developed to Study Sustainability
MoodCompass is based on a systems analysis tool developed by A New Story Foundation, a non-profit organization researching sustainability, that quantitatively measures and tracks the emotions and behavior—or “mood”—of a society. The tool can also be used to measure a society’s perception of other organized entities such as governments and other societies. Since 2006, researchers have used this tool to track the mood of US society as well as its perception of the US government and the rest of the world through the lens of US society. They use this data to gain a better understanding of the underlying dynamics of US society—i.e., “what makes it tick”—and its role in sustainability.
Then They Stumbled Onto Something…
In July of 2007, after tracking these three segments for over 18 months, researchers noticed a correlation between patterns in their profiling data and the movement of the financial markets. Specifically, the profile of US society correlated with the movement of the US stock market, the profile of its view of the US government with the movement of the dollar, and the profile of its view of the world with the movement of crude oil.
Researchers spent the rest of 2007 analyzing these correlations and identifying the mood configurations corresponding with various social responses and market reactions. By the end of 2007 they had successfully generated a model for each segment that very accurately predicted whether its corresponding market was trending up or down and when the trend was likely to shift.
MoodCompass was Born
Researchers at A New Story Foundation knew they were on to something big. If they could predict changes in social mood and the potential for instability, and demonstrate that with accurate predictions of the direction and timing of trends of the stock market, the dollar, and crude oil, that information would surely be valuable to managers, planners, and even the investment community. They could not only use it to raise money for the foundation, but more importantly to raise awareness about issues surrounding sustainability. They decided to make their global mood and market forecasting information available to interested parties, and MoodCompass was born.
How It Works
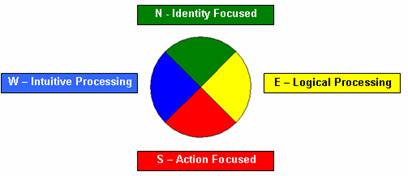
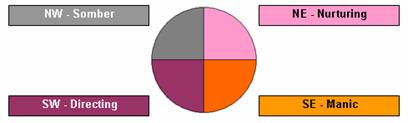
The MoodCompass profiles an entity based on the relative presence of four primary characteristics or of four hybrid characteristics. A profile expressed in terms of primary characteristics weighs the entity’s relative focus on identity (north), focus on activity (south), use of intuition (west), and use of logic (east). A profile expressed in terms of hybrid characteristics weighs the entity’s relative amount of nurturing behavior (northeast), directing behavior (southwest), manic expression (southeast), and somber expression (northwest). It was named the MoodCompass because the eight characteristics are best viewed in circular relation to one another like points on a compass:
Primary Characteristics
Hybrid Characteristics
The two sets of characteristics are inter-related. Each characteristic is a combination of the two that surround it. This relationship can be viewed by embedding a pie chart of the primary characteristics inside a pie chart of the hybrid characteristics:

For example, the primary characteristic (W) Intuitive Processing is a combination of the two hybrid characteristics (SW) Directing and (NW) Somber. Likewise, the hybrid characteristic (NE) Nurturing is a combination of (N) Identity Focused and (E) Logic Processing.
Tracking Profiles Over Time
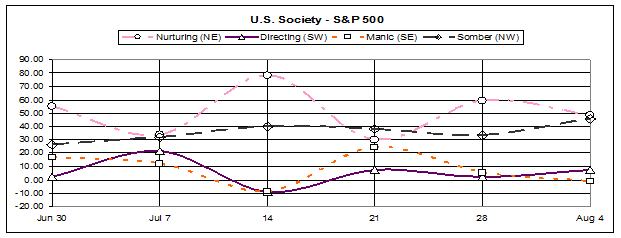
During the course of each month, researchers collect information surrounding current events and perceived future events, and qualitatively assess how much of each of the eight characteristics the entity under observation manifests. This assessment is ultimately plotted (as “mood lines”) and extended into the future to generate the MoodCompass forecasts. The four primary characteristics and four hybrid characteristics are evaluated separately, and analyzed in conjunction. Researchers have found that when plotted over time, each set of the four characteristics tends to oscillates in a somewhat regular pattern. The pattern can be extended into the future by estimating a best fit sine wave function. Researchers periodically ‘recalibrate’ the mood lines with the current events data, and readjust the best fit sine function. For convenience, and ease of presentation, only the moodlines of the four hybrid characteristics are presented in the MoodCompass.
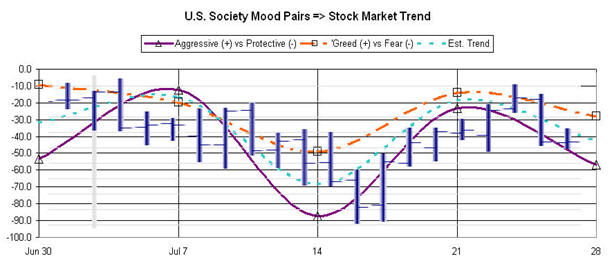
Future forecasts are examined for indications of significant changes in social stability, government focus or activity level, and ways the outside world is perceived. Market models have been developed which accurately forecasts stock market movement from the U.S. society moodlines, U.S. Dollar value from changes in the way the U.S. government is perceived, and factors affecting the price of crude oil from the way the U.S. views the world.
The two figures below show the July 2008 moodlines for U.S. society and the derived stock market forecast (as published June 27, 2008). Actual stock market data from futuresource.com has been overlaid on the bottom figure to show just how well the data matched the forecasted trend.
- - -
Philosophy and Methodology: For more information on our research and methodology, please see: http://anewstory.org/research.pdf.
Download a MoodCompass Subscription Application